We progressed in our research of counters and widgets with three experiments involving 600 participants. On them, we tested what people perceive as the “right sum” to pay given the information they see on the counter. We are grateful to Rashon and Micopeia project for providing the video, on which we tested the responses to the messages on the counters. In the last month, we used 12 different counters making visible 3 categories (the flow of money, number of members or time spent) under 4 relational models between the content makers and their supporters.
The experiments combined our previous research into the transparency/visibility of the 3 categories identified as important for the counters (active members, time, money) with the relational models mapping the relation between users and creators as a matter of hierarchy (AR - Authority Ranking, celebrity- fans status), community (CS - Community Sharing, collective goals), equality (EM - Equality Matching, tit for tot, exchange), market (Market Pricing, impersonal, speculative value).
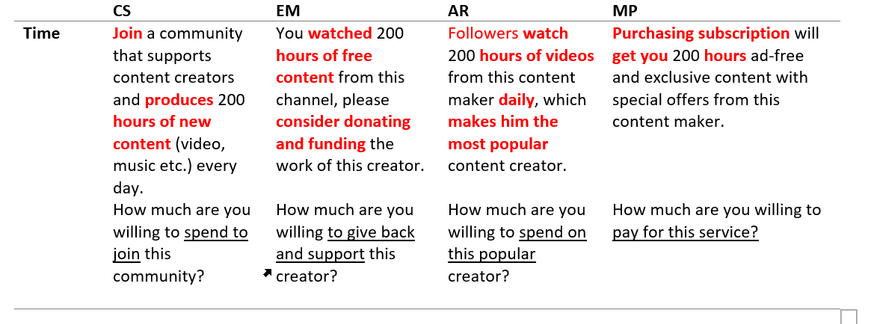
While in the previous research, we tested how different sums of money influence the decision to support given relational model, now we extended the focus to all three categories of money, time and members visibility. Each participant in the experiments was exposed to one type of counter, and this provides us with limited data to compare which elicited the highest monetary contributions. Here is an example of what became the most successful counter: "You watched 200 hours of free content from this channel, please consider donating and funding the work of this creator. How much are you willing to give back and support this creator? This counter supported EM - equality matching relational model with visible time category ("tit for tat" over time visibility). We are sharing the example of all counters at the bottom of the page (by "counters" we mean the messages eliciting response rather than webdesign elements).
We also published the three Tableau visualizations showing the reactions to the visibility of Money, Members and Time in all relational models. On the visualization you can also check how age, gender and other responses influenced the willingness to pay under different categories and relational models. In what follows, we will discuss only some of the insights that are useful for future experiments and as inspiration for other projects. There is a visible affinity between certain relational models and categories: CS (community) and MP (market) prompts seem to work best when coupled with the visibility of money, AR (hierarchy) and EM (personal exchange) with the visibility of active members and CS (community) and EM (personal exchange) with the visibility of time spent.
Box plots of the three categories (Money, Time and Members) and 4 models (EM, AR, MP, CS)

Visibility of money supports communal projects and goals
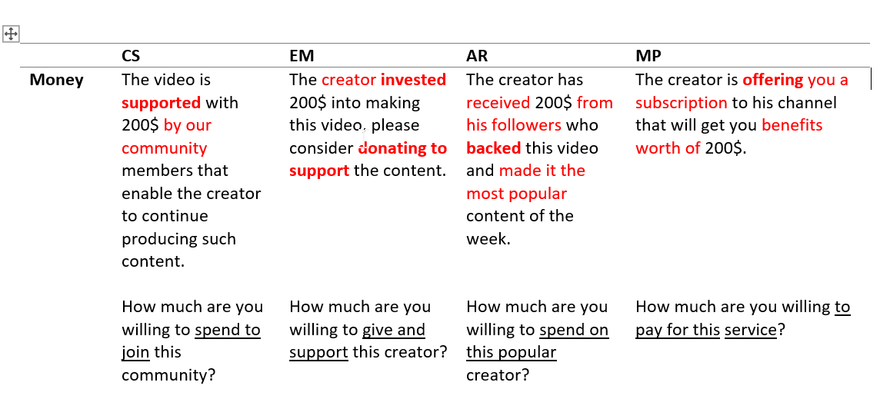
It is surprising that quantification and visualization of the flow of money (how much the content makes) supported interactions described in terms of market and community relations rather than individual, personal, one to one relations and exchanges (EM - equality based exchanges or AR - exchanges with celebrity or content maker). In other words, impersonal messages claiming that the video is supported by a community or has a clear market value elicited more money contribution than more personal tone and requests for money by the content maker. The messages on the counters that worked well were as follows: “The video is supported with 200$ by our community members that enables the creator to continue producing such content. How much are you willing to spend to join this community?” (CS-Community sharing with visible money flows on the counter) or “The creator is offering you a subscription to his channel that will get you benefits worth of 200$. How much are you willing to pay for this service?” (MP - Market Pricing with visible money category). Supporters were more willing to pay these messages rather than counters eliciting more personal relation to the content maker over money: “ The creator invested 200$ into making this video, please consider donating to support the content. How much are you willing to give and support this creator?” (EM - Equality matching with visible money category) or “The creator has received 200$ from his followers who backed this video and made it the most popular content of the week. How much are you willing to spend on this popular creator?” (AR - Authority Ranking with visible money category).
At the present, we speculate that this has something to do with a perception of a blunt quantification over money that contrasts the more personal relations and AR and EM exchanges. It seems that the categories of time or members work better with supporting more personal relation to the content maker while visibility of money works better with content perceived as part of a community support or defined by a market. Once the counter makes visible how much money the content maker makes, it seems that going “less personal” might work better, and supporters are more willing to pay when the request either mentions a collective and impersonal efforts and goal or frames it as a business offer.
Another reason why counters quantifying attention via money did not work for AR relations (where the maker was established as an authority figure, a celebrity with popular content) is probably the common reason participants mention: that the content maker is paid enough and that s/he should be supported by a brand rather than individuals. To summarize: quantification over money and its visibility on the counters depersonalizes the relation to the content maker and it works better with collective or market driven projects.
Visibility of time supports more personal relations with the content makers
Counters showing the amount of time (either spent by the users watching and interacting with the content or by the maker creating the content) surprisingly fared better in all four models. They achieved the highest median and average values of how much participants are willing to pay for content. Their upper hinge was also higher (meaning more participants were willing to pay more in the highest 25% ) and also the lower hinge was higher (in general they paid more).
Making visible and communicating how much time users or content makers spent on the content (consumption or production) seems to support generosity and more diverse and individualized responses. The CS (community sharing) and EM (equality, personal exchange) based on time achieved the highest median and average values from all the counters from all categories. We speculate that time functions as a more neutral category (it is perceived as less blunt quantification of the relations) and offers more space for individual reactions and responses to the content maker. This allows the participants to express their appreciation and relation to the content without pressure and clearly defined expectations, which seems to support generosity.
To summarize: while EM relations scored badly with counters making visible the money flow, they had best results with counters that show time. The viewers/users/supporters want to have control over how they quantify their relation to the content makers (so defining the exact amount of money feels like a pressure). The information on how much time the content maker spent on producing the content or how much someone someone is freeloading works as a more gentle nudge to pay as we can see on the successful examples: “You watched 200 hours of free content from this channel, please consider donating and funding the work of this creator”. (EM with visible time)
Visibility of members does not support community projects and goals but rather relation to celebrity content
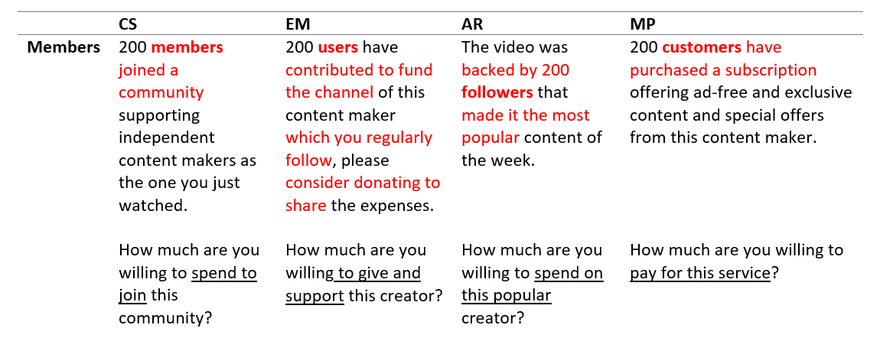
The visibility of how many active members support this content also surprised us: rather than working well as a communal prompt, information on members worked well for AR and EM (more personal, one to one exchanges). This result is still preliminary and it might still be that it has something to do with the number of members we chose to show (200). It might be that visualizing a larger or a smaller community would have had a different impact (we did not see any major effect in the counters showing different sums of money in the previous research but it may work differently with the categories of time and members).
Moreover, on the counters showing the number of members currently supporting something, we see that the CS message led to more agreement on how much to pay the community while EM and AR had more dispersed responses where half would like to pay but the other 1/2 does not want to pay anything.
Some last thoughts
It seems that users have an “anchor” for how much they are willing to pay. On all three box plots we see as the most frequent amounts between 5 and 10 USD in all categories and relational models.
AR relations which highlight a hierarchical and celebrity relational model seems to have affinity with counters that emphasize the time or members rather than the money the content attracted (average in the time category is almost 8 while under money 5 or 6 under members). It looks like once the users are aware how much the content maker makes, they feel they don’t need to support him/her. They also stated in the written feedback that once the content maker is famous, they expect brands to sponsor them. The information on time or members supports the celebrity status and feeling that we, users, want to be part of a trend.
CS - community sharing relations seem to be better supported by counters that show how much money was made (highest top value from all data - higher upper hinge 15,5 and whisker 19 also median 10). It seems that community goals and projects benefit when people see that the project is already supported by someone and it is a popular cause of monetary support. The visibility of the money also led more people to agree to pay substantial amounts, in this case 10 and more USD, given the visibility of past contributions to that content maker.
Messages on the counters under different categories:

Top comments (6)
Thanks, with Lior Zalmanson, my co-author/researcher we are looking for collaborators that would be interested to conduct more experiments with real counters based on what we see here... someone who knows how to make interledger/coil counters so we can test them on the content and see whether our hypothesis about time/money/members holds.
There were some very basic live counters that sites could display. See attached screenshot from the BRCK website on mobile.
I believe that @sharafian can provide more background on how that was exposed which could be the baseline for other experiments here.
I follow the Akita project with some awesome counters github.com/esse-dev/akita and will try to connect, maybe there is a way to create counters showing how much time/money a particular content attracted (right now they show how much users spent on webmonetized content like self-monitoring) but there is no tipping/support functionality anyway so it doesn't help really to experiment with real interaction...
Re: Akita — I'm sure that @sharon is up for connecting.
Re: Tipping — @sharafian may have some testnet style functionality available to experiment with without actual transfer of real funds...
This is really outstanding, Denisa. I love how you've approached this research.
This is fantastic research. Love these posts.