How do people view online monetization, and how open are they to accepting the web-monetization model? Do people consider their “shared values” with the content creators and ideological and value-related topics when making online content consumption decision processes? Is there a difference in the consumption habits and preferences of people from underrepresented groups compared to the general population? In this post, we share fresh from the oven results from our first survey that aimed to answer these questions.
TL;DR (because we know you are busy :))
We surveyed 300 people about their online media consumption, preferences for monetization models, and value-based and ideological considerations in online content consumption. We found that people think content creators deserve a more significant part of the income than they estimate that they receive. But also that they tend to underestimate the amount the creators are receiving. We also found that most people like monetization models by which their subscription fees are divided between the creators whose content they consume. Interestingly, people from underrepresented groups preferred a model by which funds are equally divided between the creators rather than a distribution based on the time spent on each item. However, we also found that when it comes to choosing between paying for content or seeing ads, people, perhaps unsurprisingly, generally prefer the latter.
Who were the participants in our survey?
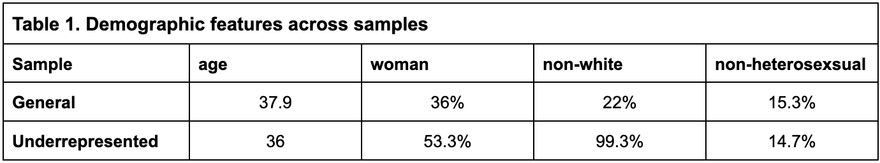
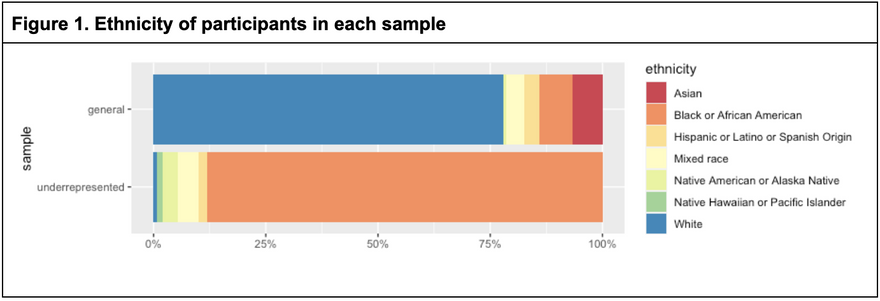
We drafted participants for our survey from the crowd-source platform Amazon Mechanical Turk. Participants were all US residents and were compensated for their time filling out the survey. We drafted the participants in two waives, each including 150 people. In the first wave, we aimed to recruit a sample representative of the general population. We will refer to it as the “general” sample. In the second wave, we recruited a sample of people from underrepresented groups (based on race and ethnicity). We will refer to it as the “underrepresented” sample. Table 1 and Figure 1 below provide information on the demographics in each sample.
Political preferences
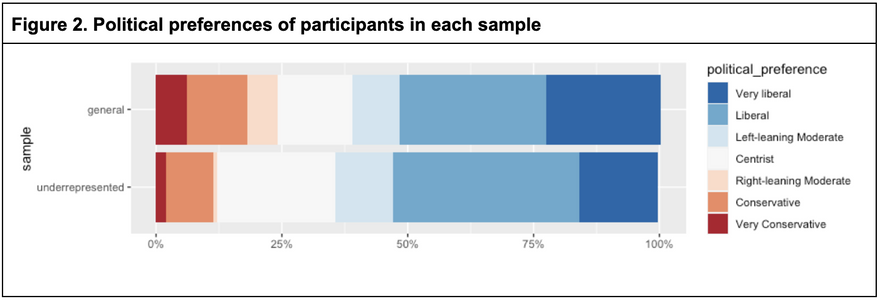
In addition to their demographic information, we were interested in learning about our participants’ political preferences. From the results shown in Figure 2, we can learn that, on average, both samples lean toward the liberal end of the political space. Comparing the two samples, it appears that the underrepresented groups sample is less conservative and more centrist (and not so much more liberal). Additionally, people from the underrepresented groups were much less likely to identify themself with the more extremist options of “very liberal” or “very conservative”.
Why do we need a sample from underrepresented groups?
Comparing people from underrepresented groups to the general population is important since we are interested in studying the potential effectiveness of web monetization for activists who are coming from, and working with, people from traditionally underrepresented groups.
People’s views on online content monetization
In this section of the study, we examined people’s knowledge of online content monetization and their preference for various monetization models.
How much of the income from advertisements goes to the creator?
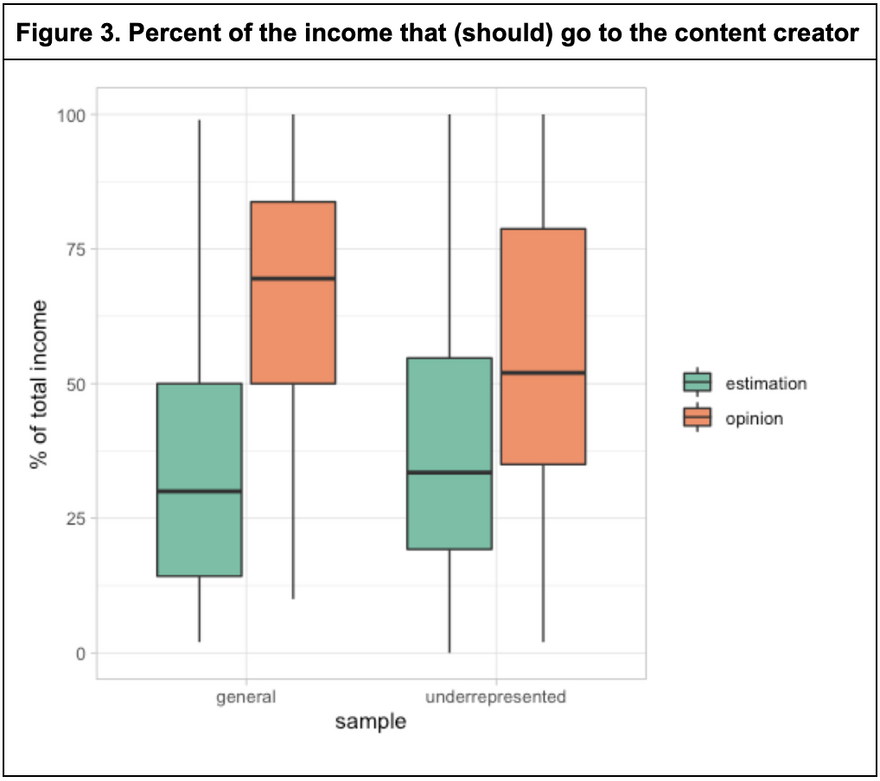
We first asked participants to estimate what percent of YouTube’s income from showing ads goes to the video creators (“estimation”). Immediately afterward, we asked what they think this percentage should be (“opinion”). As it stands today, 55% of the income from ads on YouTube goes to the creator (conditioned on the creator being in the YouTube Partner program). As shown in Figure 3, people in both samples significantly under-estimated this amount. The average estimations were 35% in the general sample and 37% in the underrepresented groups sample. Another commonality between the samples is the opinion that creators deserve a larger share of the income (in comparison to their own estimations). However, the average percentage that people in the underrepresented groups thought creators should receive (55%) was significantly lower in contrast to the opinion of people in the general sample (63%).
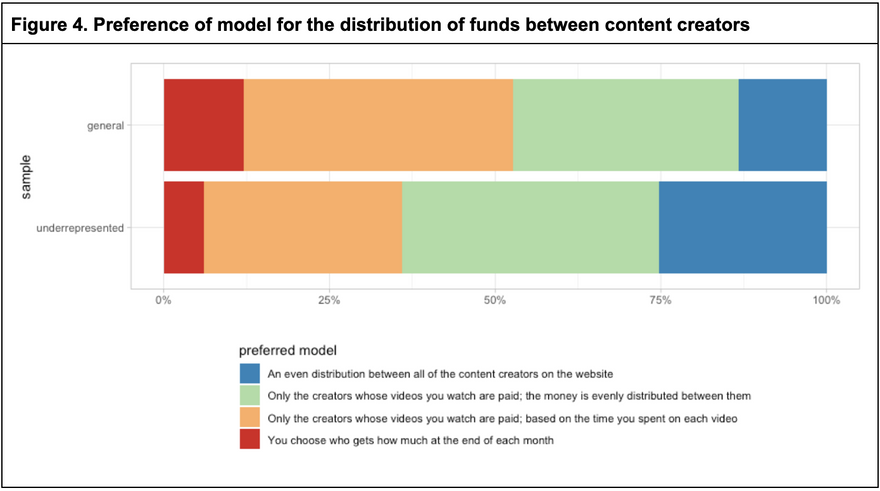
Which model do people prefer for the distribution of funds between content creators?
Next, we wished to learn about peoples’ preferences regarding how the subscription fees they pay are divided between the content creators. Again, we stayed within the context of YouTube and asked the participants to imagine that they have a Premium subscription to the platform. We then told them that out of the total $11.99 that YouTube charges, approximately $7 goes to the content creators, and asked them to choose between the following four models for the distribution of the $7 between the creators on the platform: (1) An even distribution between all of the content creators on the website, (2) Only the creators whose videos you watch are paid; the money is evenly distributed between them, (3) Only the creators whose videos you watch are paid; based on the time you spent on each video, and (4) You choose who gets how much at the end of each month. Notably, the third model was meant to represent the web-monetization/Coil model.
The results show that overall the “Coil compatible” model is supported in both samples (see Figure 4). It is the most popular model in the general sample and the second most popular in the underrepresented groups sample. Interestingly, people in the underrepresented groups sample show greater support for the models in which the money is distributed evenly between the creators. This difference might reflect a more significant appreciation for equality and a dislike of the potentially discriminating models.
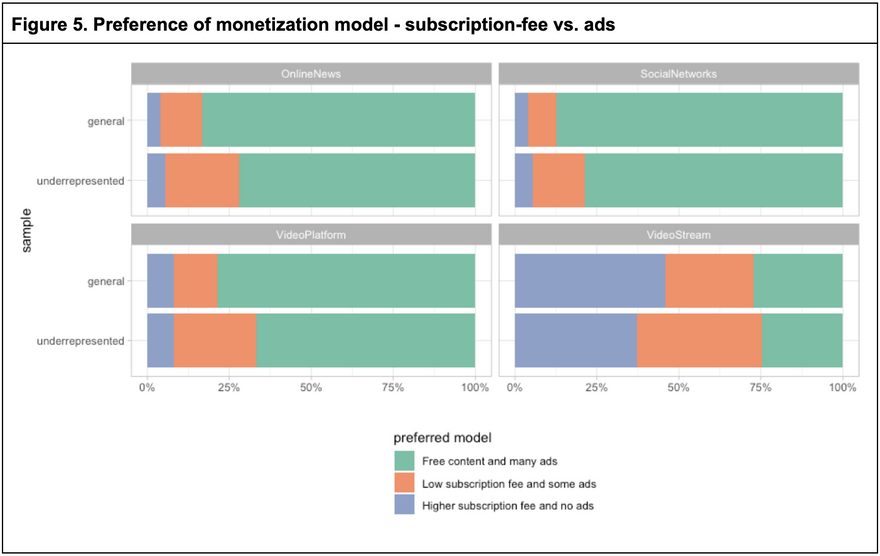
Do people prefer to see ads or pay for subscriptions?
An essential aspect of the success of the web-monetization project is people’s willingness to pay for online content. To learn more about this, we asked people to choose between three levels of subscription-fee - ads ratios across four types of online content platforms. Specifically, they could choose between (1) Free content and many ads, (2) Low subscription fee and some ads, and (3) Higher subscription fee and no ads; for each of the content types: (1) Video streaming (Netflix, Hulu, etc.), (2) Online news (foxnews.com, nytimes.com, etc.), (3) Video platforms (YouTube, TikTok, etc.), and (4) Social networks (Facebook, Instagram, Twitter, etc.).
Figure 5 shows that people dislike paying and are willing to see ads in exchange for content. However, it is important to note that seeing ads in exchange for content (and more) is what people are generally used to. Moreover, if we look at the differences between the content types, we find that people’s preferences generally reflect the current status quo - a state where the model for video streaming is a subscription fee and no ads, and social networks are free with many ads. Nonetheless, it is interesting to learn that a non-negligible number of people (21% in the underrepresented groups sample) are willing to pay to see fewer ads (or none at all) on social networks. Furthermore, people from the underrepresented groups sample were also generally more positive towards the option of a hybrid model of a low subscription fee and some ads. To sum, we suggest that these results highlight that any attempt to shift people from the models they got used to (i.e., from free ad-based models to subscription fees and vice versa) might require time and re-education of users. This seems to be especially true for the shift from free content and ads models to those requiring paying for subscriptions.
Do people make ideological and value-related considerations in their online content consumption choices?
The short answer is “yes, they do''. We also found some differences between the two types of samples, and as a factor of people’s political preferences. We will tell you all about it in the second part of this report which will be published soon.
Stay tuned.

Top comments (0)